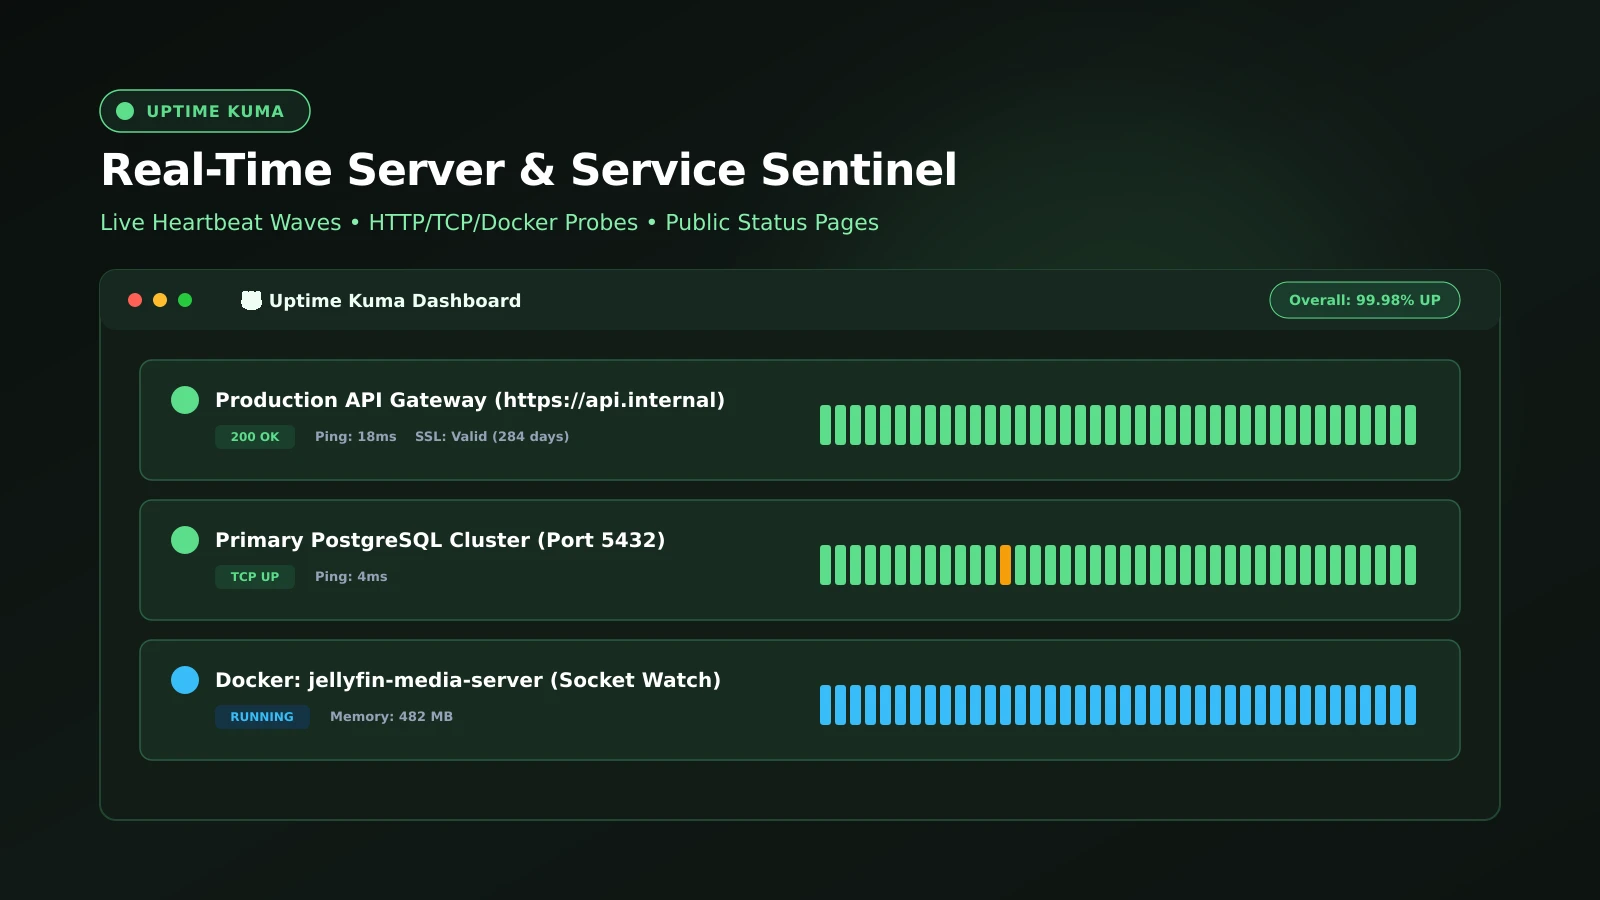
Uptime Kuma: The Complete Guide to Self-Hosted Monitoring and Status Pages
Continuous Sentinel: Server Monitoring and Public Status Pages with Uptime Kuma
Whether managing a personal homelab or operating multi-region production web applications, discovering service downtime before your users do is fundamental to reliable operations. Commercial uptime platforms like Pingdom and Better Uptime impose restrictive probe frequencies and costly subscription tiers. Uptime Kuma revolutionizes this space by offering a polished, responsive, and completely open-source monitoring powerhouse.
Engineered with a reactive Node.js and Socket.io architecture, Uptime Kuma delivers live sub-second UI updates, versatile probe methods (HTTP/s, TCP, DNS, Ping, Docker socket, Push heartbeats), and custom public status pages with zero licensing costs.
What It Is
Uptime Kuma is a self-hosted monitoring and status page platform published under the permissive MIT license by developer Louis Lam. It operates as a single lightweight container that executes scheduled health checks, tracks historical response latency, and calculates uptime SLA percentages.
The platform includes native integration with over 90 notification dispatchers (Telegram, Discord, Slack, Pushover, Email, Webhooks), featuring customizable retry thresholds to prevent transient false-positive alarms.
Why You Have Not Heard Of It
With over 90,000 stars on GitHub, Uptime Kuma is one of the most widely deployed open-source applications in existence. It gained global acclaim by replacing cumbersome enterprise monitors with an intuitive, zero-configuration interface that installs in seconds.
How It Works
Uptime Kuma operates via a clean, non-blocking asynchronous pipeline:
- Multi-Protocol Probe Engine: Dispatches interval-based queries verifying HTTP status codes (200/301), response body keywords, TCP port accessibility, and SSL/TLS certificate validity windows.
- Reactive WebSocket Layer: Streams live status changes and latency charts directly to connected browsers over Socket.io without manual page refreshes.
- Embedded SQLite Persistence: Stores all metrics and probe logs in a single local database file, automatically optimizing old records to maintain low disk usage.
Step-by-Step Deployment Guide
Deploying Uptime Kuma with Docker Compose takes less than a minute:
services:
  uptime-kuma:
    image: louislam/uptime-kuma:1
    container_name: uptime-kuma
    restart: unless-stopped
    ports:
      - "3001:3001"
    volumes:
      - ./data:/app/data
      # Optional: Map host docker socket to monitor local containers directly
      - /var/run/docker.sock:/var/run/docker.sock:ro
Launch the container:
docker compose up -dOpen http://<SERVER_IP>:3001 to create your primary administrator account and configure your first monitoring target.
What It Replaces
- Commercial Uptime SaaS (Better Uptime / Pingdom): Provides unrestricted, 20-second probe intervals without recurring seat fees.
- External SSL Expiry Checkers: Automatically alerts you 14 and 7 days prior to SSL certificate expiration.
- Hosted Status Pages: Powers custom-branded, public-facing incident dashboards accessible at subdomains like
status.yourdomain.com.
Limitations
Uptime Kuma is engineered specifically for black-box endpoint and service availability monitoring. It does not replace internal white-box telemetry stacks (such as Prometheus and Grafana) designed for deep kernel and CPU profiling.
Who It Is For
- DevOps engineers and software developers requiring instantaneous alerts when production APIs experience downtime.
- Homelab enthusiasts monitoring local server clusters, routers, and IoT hardware.
- Startups building transparent, public-facing trust centers and status pages for their user base.
Conclusion
Uptime Kuma is a masterclass in purposeful open-source design. Combining visual beauty with operational reliability, it is the undisputed king of self-hosted uptime monitoring.