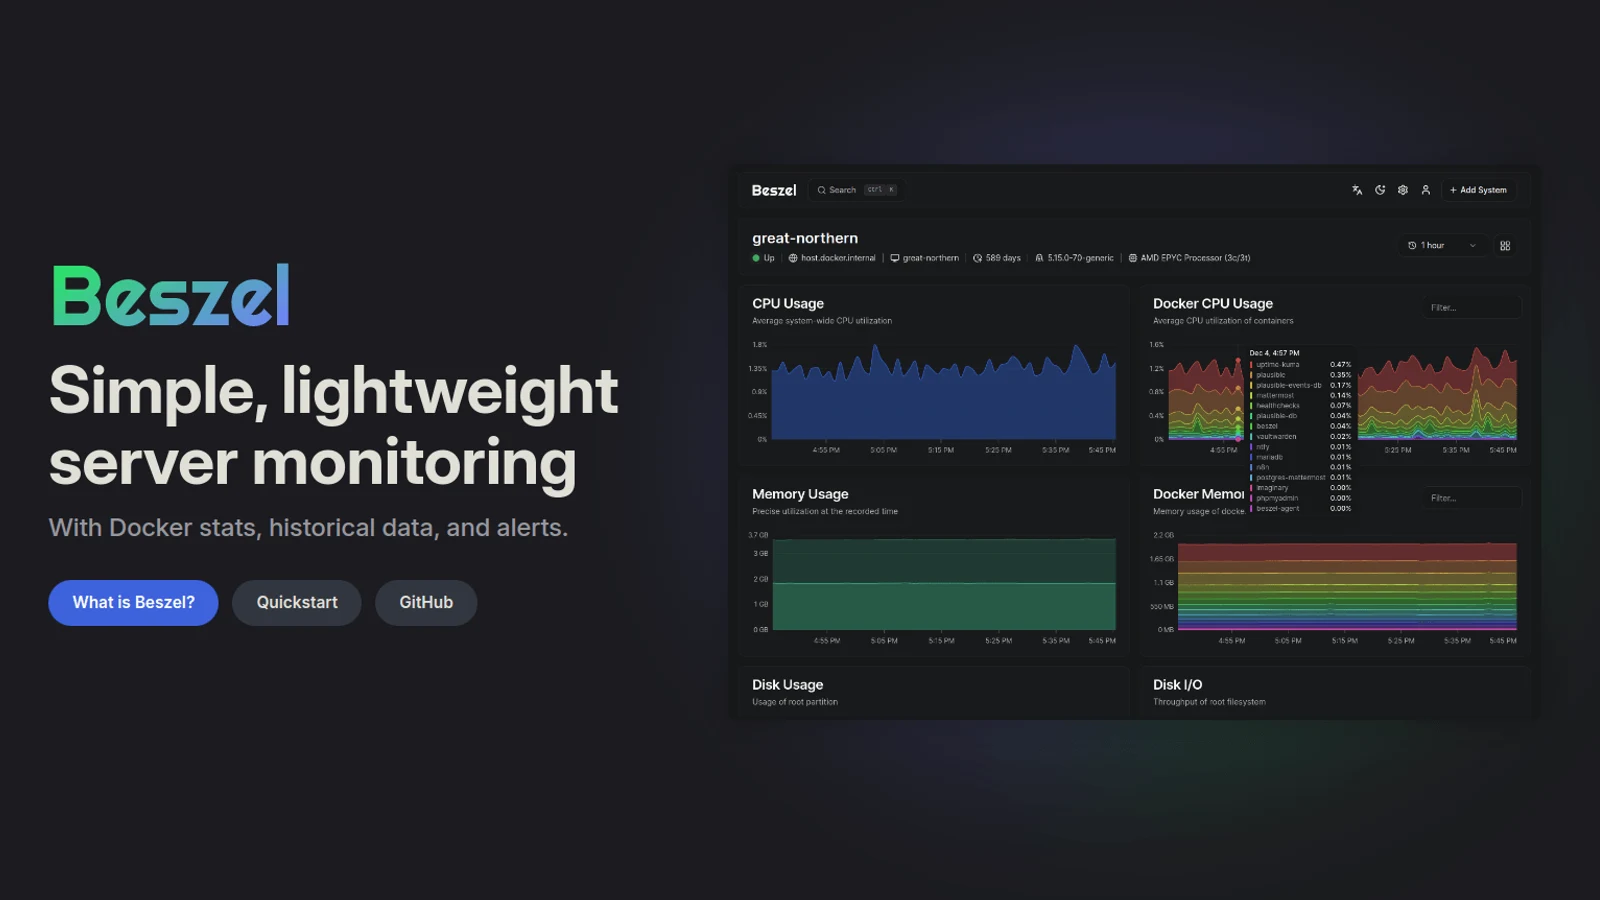
Beszel: Lightweight Server and Docker Container Metrics Monitoring Platform
Beszel: Low-Overhead Fleet Metrics, Container Telemetry, and Hardware Health Tracking
Monitoring servers across a personal homelab or a distributed fleet of virtual private servers has historically involved a stark compromise. Industry-standard monitoring pipelines combining Prometheus, Node Exporter, and Grafana frequently demand hundreds of megabytes of memory, complex PromQL query syntax, and persistent storage management just to graph CPU and disk usage. Meanwhile, real-time monitors like Netdata stream detailed sub-second graphs but consume significant CPU cycles on low-power devices like Raspberry Pis.
The Beszel project, maintained by Henry Gressmann under the MIT license with over 25,000 GitHub stars, delivers an efficient alternative. Following its v0.19.0 release in September 2026, which added advanced ZFS dataset metrics and multi-user system sharing, Beszel has become the reference platform for lightweight server observability.
What It Is
Beszel is a self-hosted monitoring system engineered for simplicity and low resource consumption. Built in Go, it adopts a clean two-tier architecture consisting of a central Hub and distributed Agents.
The central Hub provides an intuitive web interface for managing connected nodes, reviewing historical telemetry graphs, configuring multi-channel alert rules, and managing access permissions. The Agent runs as a compact daemon consuming less than 15 megabytes of RAM on each monitored machine. Together, they track system-level CPU, memory, swap, disk capacity, disk I/O, network bandwidth, GPU metrics, motherboard sensor temperatures, and per-container Docker resource consumption.
Why You Have Not Heard Of It
Enterprise monitoring vendors and open-source foundations have spent years standardizing complex time-series databases and heavy dashboard engines. Many operators assumed that gathering multi-node metrics requires deploying Kubernetes operators or writing elaborate PromQL dashboards.
Beszel emerged outside corporate marketing funnels as a focused developer response to observability bloat. By embedding PocketBase directly into the Hub binary, Beszel eliminated the need for external PostgreSQL databases, Redis message queues, or standalone authentication servers. A complete monitoring hub deploys in seconds from a single Docker container.
How It Works
Beszel separates metric collection from visualization using an asynchronous polling model secured by cryptographic keys:
The Beszel Agent samples CPU load, thermal sensors, disk I/O, and container stats from the host cgroups and /proc filesystem every few seconds.
The central Hub contacts each agent over a secure connection verified by ed25519 public keys, pulling structured metric buffers on a 60-second cycle.
Metrics write into embedded SQLite tables with automatic rollups, maintaining long-term historical records while keeping total database size under 50MB.
Users inspect charts via the web UI, while background alert workers dispatch notifications to Discord, Telegram, Pushover, or webhooks on threshold breaches.
Low-Overhead Agent Architecture
The agent binary is written in Go and communicates system stats without installing heavy dependencies. When running in a container, the agent requires only access to /var/run/docker.sock in read-only mode to capture container CPU, memory, and network throughput.
Unlike tools that expose unauthenticated HTTP metrics endpoints to the local network, the Beszel agent listens on port 45876 and validates every incoming connection using an ed25519 public key configured at startup. If the signature does not match, the agent drops the TCP connection immediately, preventing unauthorized local reconnaissance.
ZFS and Hardware Health Integration
While network monitors like Uptime Kuma verify whether an HTTP service or port responds to external pings, Beszel monitors internal host health. The v0.19.0 release brought native ZFS pool tracking, reporting capacity utilization, I/O bandwidth, scrub completion status, and per-dataset usage.
Beszel reads hardware sensor inputs directly from Linux /sys/class/hwmon, surfacing fan speeds and core temperatures. For storage reliability, it reads S.M.A.R.T. health telemetry, Linux software RAID array states, and eMMC wear indicators, providing early warning before storage drives fail completely.
Comparative Feature Analysis
Server Monitoring Tooling Comparison
| Monitoring Metric | Beszel | Prometheus + Grafana | Netdata | Uptime Kuma |
|---|---|---|---|---|
| Primary Focus | Server and container metrics | Enterprise time-series analytics | Real-time diagnostic metrics | Service uptime and ping checks |
| Hub Memory Footprint | ~35MB to 60MB RAM | 400MB to 1.2GB RAM | Single-node agent (~80MB) | ~60MB to 90MB RAM |
| Agent Memory Footprint | Under 15MB RAM | 30MB to 60MB (Node Exporter) | Embedded in server instance | No agent (remote prober) |
| Historical Data Retention | Built-in SQLite rollups | TSDB with configurable retention | Ephemeral memory cache | SQLite incident logs |
| Docker Container Stats | Automatic per-container graphs | Requires cAdvisor container | Built-in cgroups parser | Basic container status check |
| Configuration Complexity | Zero configuration out of box | High (PromQL, YAML, Dashboards) | Low to Medium | Low |
| ZFS & Sensor Telemetry | Native support | Requires custom exporters | Native support | Not supported |
Running It
Setting up a complete monitoring environment requires deploying the Hub on your primary management server and running the Agent on every node you wish to monitor.
Deploying the Beszel Hub
The Hub runs inside a single Docker Compose container with persistent data:
services:
  beszel:
    image: henrygd/beszel:latest
    container_name: beszel-hub
    restart: unless-stopped
    ports:
      - "8090:8090"
    volumes:
      - ./beszel_data:/beszel_data
    environment:
      - PORT=8090
After launching the Hub, open http://<hub-ip>:8090 in your browser to create your admin account. Click “Add System” to copy your public ed25519 key.
Deploying the Beszel Agent
On any machine you want to monitor (including Proxmox hosts, VPS instances, or Raspberry Pis), launch the Agent service:
services:
  beszel-agent:
    image: henrygd/beszel-agent:latest
    container_name: beszel-agent
    restart: unless-stopped
    network_mode: host
    volumes:
      - ./beszel_agent_data:/var/lib/beszel-agent
      - /var/run/docker.sock:/var/run/docker.sock:ro
    environment:
      - LISTEN=45876
      - KEY="ssh-ed25519 AAAAC3NzaC1lZDI1NTE5AAAAI... (copied from your Hub UI)"
What It Replaces
Beszel replaces heavy Prometheus and Grafana deployments on machines where operators simply need reliable historical resource graphs, container consumption tracking, and alert dispatching without managing PromQL query alerts. It pairs effectively alongside uptime probes like Uptime Kuma and container stack managers like Dockge, providing complete internal and external visibility.
Limitations
- Not a Distributed APM: Beszel is designed for infrastructure and container resource monitoring. It does not ingest application-level distributed traces, OpenTelemetry spans, or microservice call graphs.
- Fixed Metric Collection Interval: The default collection interval is fixed at 60 seconds for historical polling. Operators requiring sub-second high-frequency tick charts for real-time kernel debugging will still need Netdata.
- No Complex Calculated Metrics: Beszel focuses on clear, standard graphs. It does not provide an arbitrary math expression language like PromQL to perform multi-node vector calculations across arbitrary label sets.
Who It Is For
Beszel is designed for homelab operators, system administrators managing fleets of 1 to 50 servers, and developers running multi-container Docker workloads who want dependable visibility and alerting without sacrificing system memory.
Summary Assessment
Beszel delivers practical host and container telemetry without the resource footprint or configuration complexity of Prometheus and Grafana. Its lightweight Go daemon, native ZFS and hardware sensor metrics, and single-container PocketBase hub provide an efficient monitoring tier for homelab fleets and distributed VPS instances.